

in·fo·graph·ic /infōˈɡrafik/ noun. A visual image such as a chart or diagram used to represent information or data
“A good infographic is worth a thousand words.” – The Internet
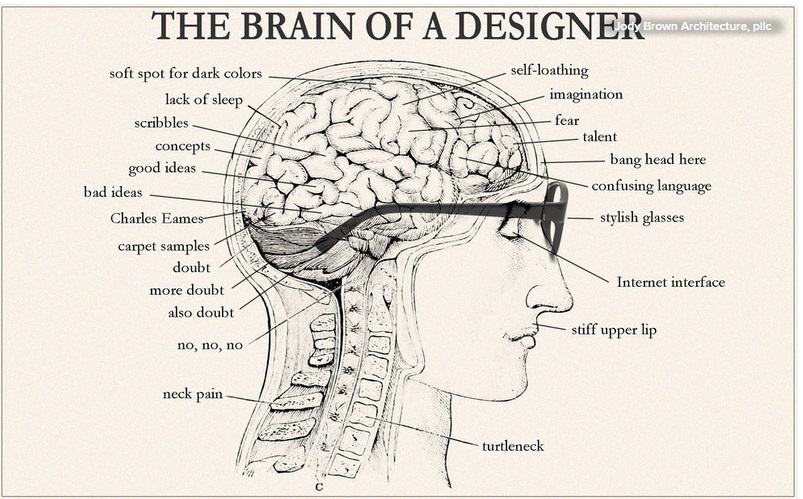
Infographic is one of those buzzwords that tends to be a bit overused. While they may seem like a recent invention, we’ve always had them in one form or another (see left), but the term has come to represent stylish, snazzy, clever illustrations of things not typically represented graphically.
Some of the best and cleverest infographics about design can be found on Houzz, which is hands down the most useful website for design ideas and inspiration in the western world. If you have an interior or exterior design project, this is the place to go for inspiration. The site has a section called Fun Houzz, which includes useful articles like “How to Build a Steampunk Cat Transit System” and “How to Survive an Epidemic of Walking Dead,” and it is where I came across this brilliant work.
©Jody Brown Architecture
©Jody Brown Architecture
©Jody Brown Architecture
©Jody Brown Architecture
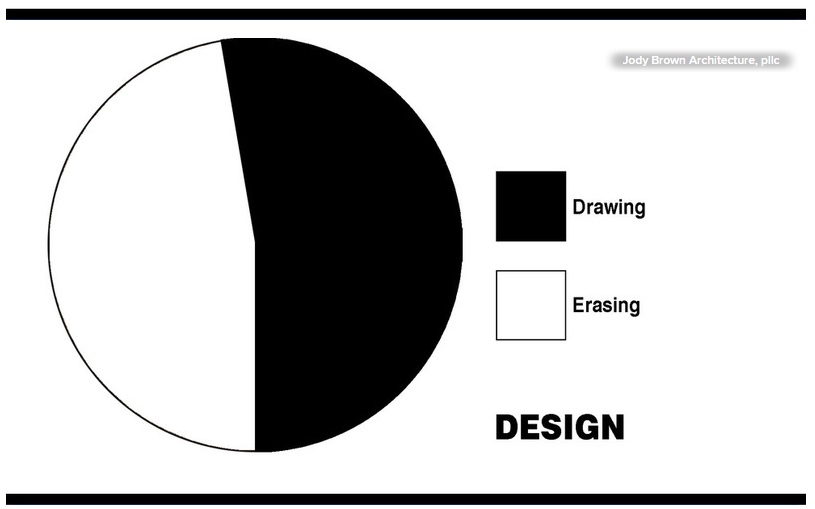
I don’t know how Jody Brown Architecture finds time to work, what with being busy making awesomely funny graphics all day long. If you enjoyed those, you should check out some of their other seriously clever pieces, like Design Explained in Pie Charts:
©Jody Brown Architecture
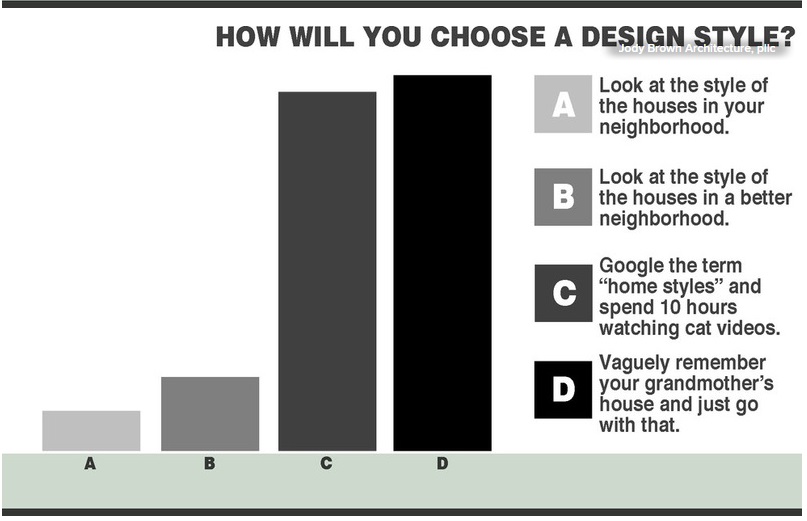
And you might consider Hitting the Bars to Explain the Design Process:
©Jody Brown Architecture


November 10, 2014 at 9:58 am
Perhaps it’s time to change your a tagline to “Internettal Treasure Hunter” – another brilliant find!
LikeLiked by 1 person
November 10, 2014 at 10:37 am
I love that! Thanks.
LikeLike